Household real estate holdings as per All-India Debt and Investments Survey (NSS 77th, 2019)

The All-India Debt and Investments Survey (NSS 77th, 2019) provides us an estimate for the value of real estate holdings of households broken down by land and building value.
Valuation method
Value of land as on 30.06.2018 was reported as per their normative/guideline values. For buildings, valuation was done as per the market price prevailing in the locality.
By “normative/guideline values”, I guess they mean the minimum value set by the government for sale registration and taxation (what are also called “circle rates”, at least in my state of Delhi). If that’s true, I think it’s important to mention that there is good reason to believe that this is likely an underestimate and probably more of an underestimate than the method used by the World Bank to estimate agricultural land values.
To estimate the total household land/building/real estate values, I had to use other data and had to make a couple of assumptions. I took the figure for total population from World Bank, made the assuption of urban India’s share of GDP as 60% based on UN’s World Urbanization Prospects, 2018 and took the household size as 4.51 for both urban and rural areas.
You can see how I did that here.
Potential issues with the data
Here’s what Credit Suisse’s Global Wealth Databook says about the issues with survey data in general:
Data on wealth obtained from household surveys vary in quality, due to the sampling and non-sampling problems faced by all sample surveys. The high skewness of wealth distributions makes sampling error important. Non- sampling error is also a problem due to differential response rates – above some level wealthier households are less likely to participate – and under-reporting, especially of financial assets. Both of these problems make it difficult to obtain an accurate picture of the upper tail of the wealth distribution using survey evidence alone. To compensate, wealthier households are over- sampled in an increasing number of surveys. This is best done using individual information, as in the US Survey of Consumer Finances, the Household Finance and Consumption (HFCS) surveys in Finland, France and Spain, and the Wealth and Assets Survey (WAS) in the United Kingdom (Vermeulen, 2018). Over- sampling at the upper end is not routinely adopted by the developing markets that include asset information in their household surveys, but the reported response rates tend to be higher than in developed markets and the sample sizes are very large in some cases, e.g., in India.
What am I trying to do?
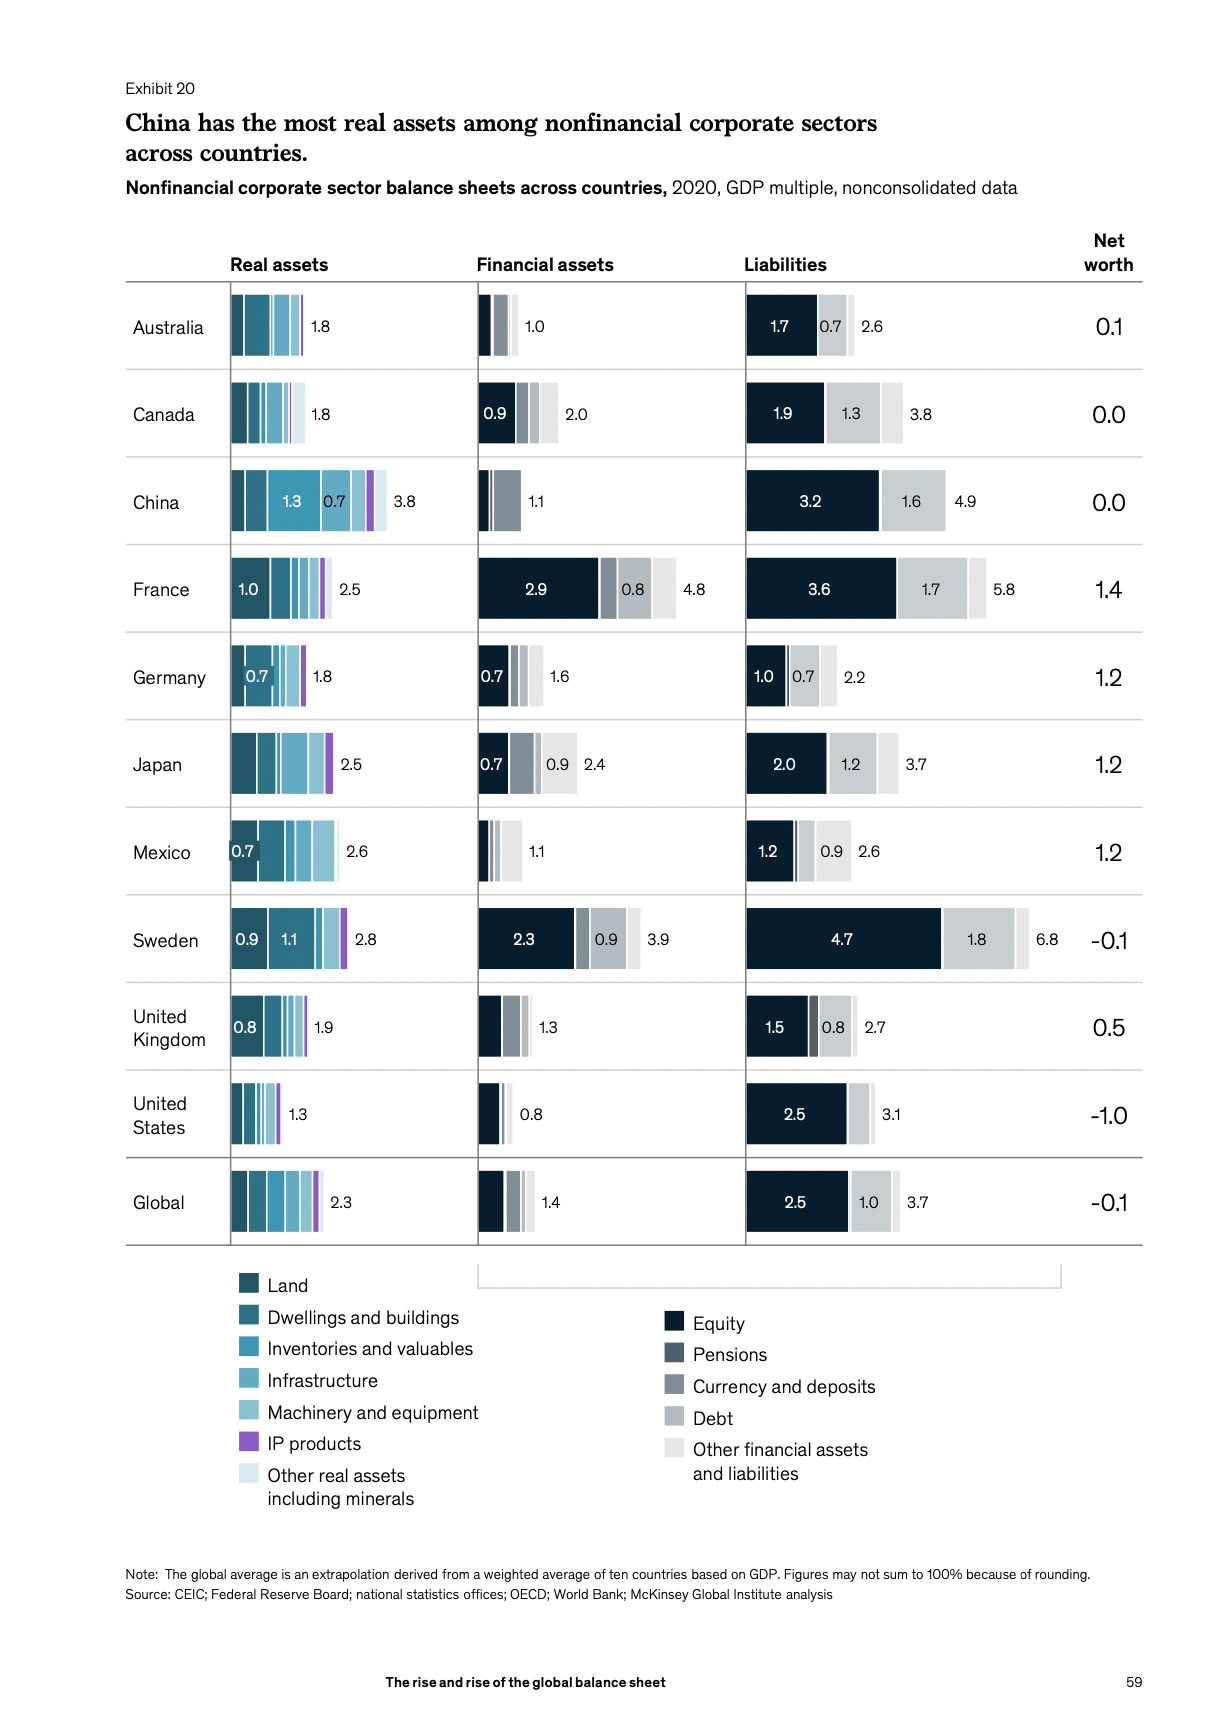
For context, I’m collecting data to estimate how much revenue can the Indian government raise via an LVT. Since I’ve already found estimates for the land owned by households, surplus land owned by the government and natural resource rents, I consider this job to be mostly done — I just have to find a reasonable estimate for the land held by non-financial corporations (NFCs) and non-profits. I guess the government should have the data on real assets of NFCs since they submit balance sheets annually but I think that method would underestimate land values by quite a lot because I think land’s value is recorded at the historical cost, not fair value. In any case, I haven’t been able to find that data. I was able to find the financial stocks and flows from the RBI, not real assets. Credit Suisse’s Global Wealth Databook also doesn’t include the value of real assets of NFCs. The only estimate I’ve been able to find is McKinsey’s estimates for other countries that they use to compute the global average: